Numerical variability and neuroimaging reproducibility
Numerical differences matter when they change the quantities used in a scientific analysis. An image comparison alone does not establish the stability of regional measurements, group contrasts, or longitudinal associations. This guide develops a simple variance model and a synthetic example of threshold crossings under repeated numerical realizations.
Separate sources of variability
For subject \(i\) and arithmetic realization \(k\), consider the additive model
\[Y_{ik}=\theta_i+\varepsilon_{ik}.\]The latent value \(\theta_i\) is fixed across numerical repetitions; \(\varepsilon_{ik}\) represents the chosen numerical perturbation. For the derivations below, assume centered errors with variance \(\sigma_{\mathrm{num}}^2\), independence across subjects and repetitions, and independence from the latent subject values. Let the latent population variance be \(\sigma_{\mathrm{pop}}^2\). Then
\[\operatorname{Var}(Y)=\sigma_{\mathrm{pop}}^2+\sigma_{\mathrm{num}}^2.\]These assumptions define an illustrative model. Real numerical errors can depend on anatomy, pipeline state, and the measured region. Acquisition noise, scanner differences, and motion are additional sources of variation rather than instances of numerical roundoff.
Repeated processing of the same input estimates within-subject dispersion:
\[\widehat\sigma_{\mathrm{num}}^2= \frac{1}{N}\sum_{i=1}^{N}\frac{1}{R-1} \sum_{k=1}^{R}(Y_{ik}-\bar Y_i)^2.\]The variance of subject means also contains residual numerical variance \(\sigma_{\mathrm{num}}^2/R\) under this model. It should not be treated as a pure population variance without acknowledging that contribution.
Ratios, contrasts, and longitudinal differences
Use the explicitly defined standard-deviation ratio
\[r=\frac{\sigma_{\mathrm{num}}}{\sigma_{\mathrm{pop}}}.\]This guide uses \(r\) for its synthetic model. The Parkinson’s MRI study introduces its Numerical-Population Variability Ratio workflow for measured data; consult its definitions and estimator when reproducing that analysis. A standard-deviation ratio and a variance ratio are different: for \(r=0.3\), the numerical variance is \(0.09\sigma_{\mathrm{pop}}^2\), not 30% of it.
For independent groups of sizes \(n_A,n_B\), the numerical contribution to the variance of a difference of group means is
\[\operatorname{Var}_{\mathrm{num}}(\bar Y_A-\bar Y_B) =\sigma_{\mathrm{num}}^2(1/n_A+1/n_B).\]For a longitudinal difference within one subject, it is
\[\operatorname{Var}(\varepsilon_{i,1}-\varepsilon_{i,0}) =\sigma_1^2+\sigma_0^2-2\operatorname{Cov}(\varepsilon_{i,1},\varepsilon_{i,0}).\]Ignoring covariance can overestimate or underestimate the uncertainty of a change score. Propagate the perturbations through the actual analysis rather than inferring inferential stability from an image-level similarity measure.
Reproduce a synthetic threshold-crossing experiment
Download neuroimaging_variability.py:
python3 neuroimaging_variability.py
The standard-library script constructs two groups of 40 latent values, with sample standard deviation one in each group and a mean difference of −0.44. It adds independent Gaussian errors at standard-deviation ratios 0, 0.1, 0.3, and 0.6, keeping the cohort fixed for 500 realizations. No patient data or MRI pipeline is used.
For illustration, the normal-reference statistic uses the known population variance, and the same reference is applied to the unperturbed cohort and to every realization:
\[z_k=\frac{\bar Y_{B,k}-\bar Y_{A,k}}{\sqrt{2/40}}, \qquad p_k=2\{1-\Phi(|z_k|)\}.\]| The cohort was deliberately centered near a two-sided 0.05 threshold: its unperturbed normal-reference p-value is approximately 0.04910, so $$ | z_0 | \(exceeds the critical value 1.95996 by only\)\delta\approx0.0078\(. Under this model the added errors shift\)z_k\(by a centered Gaussian with standard deviation\)r\(, and a crossing has probability close to\)\Phi(-\delta/r)\(, which is already near one half at\)r=0.1\(. The [recorded run](/assets/examples/results/neuroimaging-variability.json), seed 20261008, crossed that decision threshold in 45.6%, 48.8%, and 51.8% of realizations at\)r=0.1$$, 0.3, and 0.6. The crossing fraction reflects the distance of the contrast from the threshold relative to the numerical noise, not the size of the noise alone. This fraction is conditional on the constructed contrast and simulation settings. It is not a clinical false-positive rate, a power estimate, or a reproduction of the paper’s measured flip probabilities. |
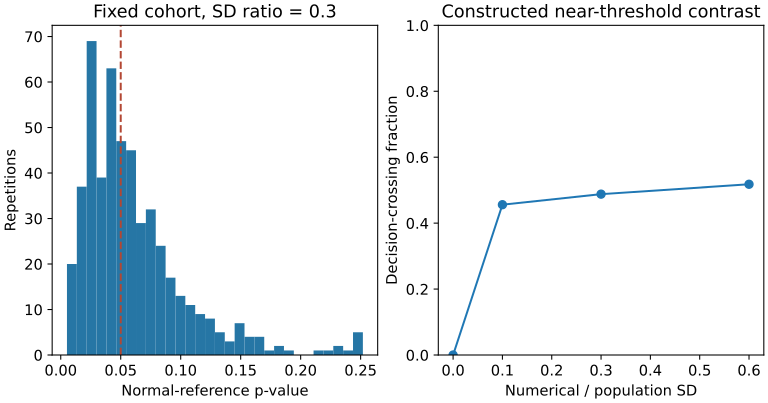
Figure: an intentionally near-threshold synthetic contrast. The repeated realizations hold subject values fixed and change only the added numerical errors.
Regenerate with Matplotlib 3.11.2:
python3 neuroimaging_variability.py --plot neuroimaging-variability.svg
The recorded environment was Python 3.12.3, Matplotlib 3.11.2, and NumPy 2.5.3 on Linux x86_64. Numerical simulation and statistics use the standard library.
Study design and reporting
Keep scans, preprocessing parameters, application random seeds, and cohort membership fixed while changing the specified numerical realization. Save regional measurements and repeat the complete statistical analysis. Report effect estimates, distributions, numerical coverage, and the chosen decision threshold; a stable significance label can conceal a varying estimate.
The results-stability study addresses a related software-testing question: whether a candidate pipeline result is compatible with a numerical reference distribution. Its voxelwise testing assumptions and multiple-comparison correction differ from the known-variance scalar illustration here.
Repeated variability is evidence about the selected perturbation model. It does not by itself establish accuracy, biological validity, or coverage of all possible execution environments.
References and resources
- Chatelain and colleagues (2026), The practical impact of numerical variability on structural MRI measures of Parkinson’s disease.
- Study code and reproducibility artifacts.
- Chatelain and colleagues, A numerical variability approach to results stability tests and its application to neuroimaging.
- Verificarlo and Fuzzy PyTorch.